

Annals of Cardiology and Vascular Medicine
HOME /JOURNALS/Annals of Cardiology and Vascular Medicine- Research Article
- |
- Open Access
- |
- ISSN: 2639-4383
Characterization of Waves in an Electrocardiographic Signal Using Various High-Energy Rays from its Spectral Content
- Rerbal S;
- Genie Biomedical Laboratory (GBM), Faculty of Technology, University A.B.Belkaid-Tlemcen BP 119, Tlemcen, Algeria
- Debbal SM*;
- Genie Biomedical Laboratory (GBM), Faculty of Technology, University A.B.Belkaid-Tlemcen BP 119, Tlemcen, Algeria
- Meziani F
- Genie Biomedical Laboratory (GBM), Faculty of Technology, University A.B.Belkaid-Tlemcen BP 119, Tlemcen, Algeria
| Received | : | Jun 11, 2020 |
| Accepted | : | Jul 23, 2020 |
| Published Online | : | Jul 30, 2020 |
| Journal | : | Annals of Cardiology and Vascular Medicine |
| Publisher | : | MedDocs Publishers LLC |
| Online edition | : | http://meddocsonline.org |
Cite this article: Rerbal S, Debbal SM, Meziani F. Characterization of Waves in an Electrocardiographic Signal Using Various High-Energy Rays from its Spectral Content. Ann Cardiol Vasc Med. 2020: 3(1); 1021.
Keywords: ECG; Temporal analysis; Spectral analysis; FFT; Spectral Density; Fundamental Frequency; VB6.
Abstract
The electrocardiogram is considered to be one of the most powerful diagnosis tools in medicine; it is routinely used in the assessment of the heart function. In this work, an application was developed and implemented in the Visual Basic (VB) Environment, in order to study the processing time through the detection of the R peak and the selection of different waves (P wave, T wave and QRS complex) present in an ECG. The spectral processing is used to perform the characterization of different waves constituting this ECG signal, by means of different high-energy rays using the Fast Fourier Transform (FFT) algorithm which is based on Radix2 and the Index Approach. This is done to eliminate redundancy in calculations.
Introduction
Heart disease is one of the main causes of death in the world and much effort is expended on its diagnostic and treatment. The electrocardiogram gives us important information and a power diagnostic tool in medicine. Different waves reflect the activity of different areas of the heart [1]. A normal electrocardiogram ECG consists of P wave, QRS complex and T wave (Figure 1). The P wave is caused by electric currents produced by the depolarization of the atria before their contraction, while the QRS complex is caused by electric current produced by the depolarization of the ventricles prior to their contraction, during the extending of the depolarization in the ventricular myocardium [2].
This work reviews current knowledge about the patient’s heart condition as the identification of the several waves in the ECG by selection of their different waves (P wave, T wave and QRS complex) in spatial and temporal domain, the detection of the peak R for extract the HRV Signal and calculate the heart frequency. The spectral Analysis (SA) give us the different waves constituting this ECG signal by means a different high-energy rays.
Methodology and Results
ECG Signal Acquisition
The ECG signal acquisition has been obtained using electronic circuit realized in our laboratory and connected to a computer with RS232 port [3].
The Interface of data transfer contains the real time ECG signal and information source of the patient in our case. This ECG signal is collected on derivation DI of 10 volunteers. The interface shown in Figure 2 is realized for the acquisition and display of morphological electrocardiographic signal with is acquired and stored in the *. DAT file. Our Interface user Graphic (GUI) is realized by Visual Basic Environment (Figure 3), this GUI is enables to record, storage, display and analysis of Physiological Signals. These signals benefit of three analyzes: Spatial, temporal and spectral analysis.

Figure 1: Basic morphology of typical ECG signal.

Figure 2: Layout of electrocardiogram ECG.

Figure 3: Interface user graphic.
Spatial Analysis
The display spatial analysis show the amplitude of each wave selected for ECG signal by the T wave, the P waveandthe QRS complex which are represented on the fallowing Figure 4.The selection of each waves P, T wave and QRS complex give respectively the magnitude of 0.14 mV, 0.25 mV and 1.34 mV.
Temporal Analysis
The temporal analysis shows the duration of each selected waves P, T and the RR interval corresponding of duration between each heartbeat which are represented on the Figure 5.The P wave, the T wave and the RR interval have respectively the duration of 0.09s, 0.13s and 0.72s corresponded respectively to the fallowing frequencies of 10.76Hz, 7.17Hz and 1.37Hz.
Detection of ECG signal peaks
Several peak detection algorithms have been used [4].The following chart proposed algorithm detects the peak of different signal, ECG in our case by averaging, thresholding and windowing:
The algorithm developed includes the following step:
Load the signal ECG.
Finding the R peak and identifies her position in time (Figure 7).
The heart rate variability (HRV)
The HRV signal represents the variability of the cardiac cycle frequency to another [5]. It is a good indicator of cardiac arrhythmia. The average period options calculate and display the average period and heart rate (Figure 8).
The HRV signal of this ECG is varying around 70 BMP, and the variability of RR interval is low than 0.5s.

Figure 4: Spatial analysis of ECG signal.

Figure 5: Temporal analysis of ECG signal.

Figure 6: Flow chart of the proposed algorithm.

Figure 7: Detection of R peak.

Figure 8: HRV signal and average period.
Spectral Analysis
The spectral Analysis allows decomposition of the signal into frequency component using the FFT algorithm. The basic assumption behind FFT analysis is that a frequency domain description is likely to reveal important information which is not apparent in the time domain signal [6].
We developed an Algorithm for its calculation which is based on the discrete Fourier Transform of N order which is given by:
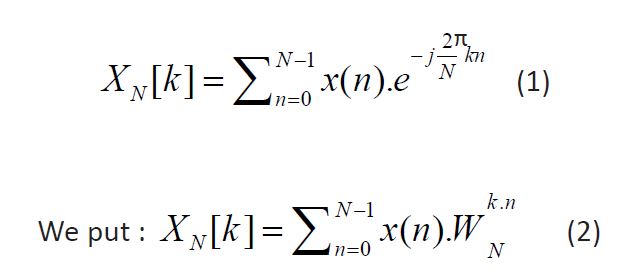

N is the length of the input sequence, N=212.
n is the index of the input sequence in time domain 0 ≤ n ≤ N-1 and k is the index of the output sequence in frequency domain 0 ≤ k ≤ N-1.
The Radix 2 algorithm consist of decomposing an N-point DFT into a series of successive 2 points, m steps of processing are necessary for calculation, where m=log2(N).
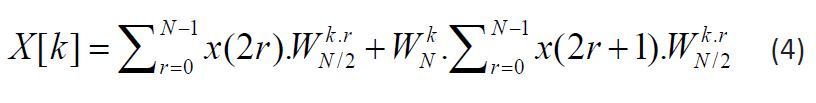
And
This DFT is expressed in two sub sequence of N/2 points of two subsequence’s of even and odd index. A new decomposition is established for each sub sequence of N/2 points into two shorter sequence of N/4. The process can continue until we get a series of sub-sequence 2 points. The complete decomposition generates a FFT algorithms commonly used as the Radix 2 with time interleaving.
The ECG spectral content is from 0 to 150 Hz [7] on the spectrum shown in Figure 9, we found the spectral density relative of QRS complex to the frequency of 13.79 Hz, which corresponds to the high energy frequency of the ECG signal.
The temporal analysis shows the duration of the QRScomplex which is 0,07s shown on Figure 10.
The spectral density of the P wave is situated at the frequency 10,27Hz shown on Figure 11.
The temporal analysis shows the duration of the P wave which is 0,09s shown on Figure 12.
The spectral density of the T wave is situated at the frequency 7,13Hz, shown in Figure 13.
The temporal analysis shows the duration of the T wavewhich is 0,13s shown on Figure 14.
The spectral density of the RR interval is situated at thefrequency of 1,3Hz, shown on Figure 15.
The temporal analysis shows the duration of the RR Interval which is 0,72s shown on Figure 5.

Figure 9: FFT plot of the ECG signal.

Figure 10: Plot of temporal analysis of the ECG signal to select the QRS complex.

Figure 11: FFT plot of the ECG signal. Plot of FFT of the ECG signal

Figure 12: Plot of ECG temporal analysis of P wave.

Figure 13: Plot of FFT of the ECG signal.

Figure 14: Plot of ECG temporal analysis of T wave.

Figure 15: Plot of the FFT of the ECG signal.

Figure 16: Plot of the ECG autocorrelation.
The average power density of the ECG
The average power spectral density of the ECG is calculated from the Fourier transform of the autocorrelation function of this signal [8].
The autocorrelation function has been implemented according to the definition formula:
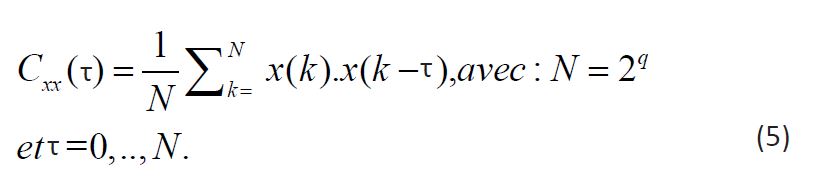
The autocorrelation function is presented on the Figure 16.
In the spectral representation of the autocorrelation function of the ECG signal (Figure 17), we can easily distinguish different high-energy rays corresponding to the QRS complex (f=13.74 HZ), the P (f=10,27Hz) and T (f= 7,08 Hz) waves.

Figure 17: Plot of the average power spectral density of the ECG.
Table 1: Results of spectral, spatial and temporal analysis.
We notice that the spectral representation of the ECG autocorrelation is only an improvement of the ECG spectrum which is shown in figure 15.
Results table
The Table 1 shown the results of spectral, spatial and temporal analysis,
The following results have been calculated by averaging 10 ECG recordings in DI.
Conclusion
This work is essentially a technological character of development software by providing cardiologists processing tools of the powerful signal that can help them to establish their diagnosis and guide their treatment approach.
We have developed three analyses, in first the spatial analysis allows to select and display different amplitudes selected waves, secondly the temporal analysis has allows selecting and display different durations selected waves and third the spectral analysis joins the last analysis to confirm their results.
We can say also that the maximum power corresponds to the QRS complex and the displacement of this energy toward the low frequencies are stand for a growth in the duration of the QRS complex.
An enlargement of QRS complex (> 0.10 sec) is particularly susceptibleto the suddenoccurrence of rhythm disorders most often fatal.
References
- Neophytou N. ECG Analysis in the Time-Frequency Domain, IEEE 12th International Conference on Biominformatics & Bioengeneering (BIBE), Larnaca, Cyprus. 2012: 11-13.
- Chiarugi F. New Development in the Automatic Analysis of the Surface ECG: The Case of Atrial Fibrillation. Hellenic Journal of Cardiologiy. 2008; 49: 207-221.
- Rerbal S, Benabdellah M. Development of a Human Machine Interface of Information and Communication in Telemedicine HMI-ICTM: Application to Physiological Digital Signal Processing in Telemedicine. International Journal of Engineering Inventions. 2013; 2: 2319-6491.
- Pan J, Tompkins WJ. A Real-Time QRS Detection Algorithm. IEEE Transactions on Biomedical Engineering. vol. BME. 1985; 32: 246.
- Malik M, Camm AJ. Components of heart rate variability- What they realy mean and what we really measure. The American Journal of Cardiologie. 1993; 72: 821-822.
- Kamath M V, Fallen FL. Correction of the Heart Rate Variability Signal for Ectopics and Missing Beats, in M. Malik and A. J. Camm, (eds.). Heart Rate Variability, Armonk, NY: Futura Publishing. 1995: 75-85.
- Sun W, J. Zhang J. Measurement of decay time based on FFT. Elsevier Ltd. 2003.
- Houghton A W, Reeve C D. Detection of spread-spectrum signals using the time domain filtred cross spectral density.IEE proc.-Radar, SonarNavig. 1995; l142: 6.
MedDocs Publishers
We always work towards offering the best to you. For any queries, please feel free to get in touch with us. Also you may post your valuable feedback after reading our journals, ebooks and after visiting our conferences.