

Annals of Cardiology and Vascular Medicine
HOME /JOURNALS/Annals of Cardiology and Vascular Medicine- Research Article
- |
- Open Access
- |
- ISSN: 2639-4383
Spectro-Temporal Characteristics of the Internal Components Mitral (M1) and Tricuspid (T1) of the First Heart Sound (S1) Pulmonary (P2) and Aortic (A2) of the Second Cardiac Sound (S2) Using the Continuous Wavelet Transform (CWT)
- L Hamza Cherif;
- Genie -Biomedical Laboratory (GBM), Department of Genie Electric and Electronic, Faculty of Technology, University Aboubekr Belkaid Tlemcen, Algeria
- SM Debbal*
- Genie -Biomedical Laboratory (GBM), Department of Genie Electric and Electronic, Faculty of Technology, University Aboubekr Belkaid Tlemcen, Algeria
| Received | : | Jul 06, 2020 |
| Accepted | : | Aug 17, 2020 |
| Published Online | : | Aug 25, 2020 |
| Journal | : | Annals of Cardiology and Vascular Medicine |
| Publisher | : | MedDocs Publishers LLC |
| Online edition | : | http://meddocsonline.org |
Cite this article: Cherif LH, Debbal SM. Spectro-Temporal Characteristics of the Internal Components Mitral (M1) and Tricuspid (T1) of the First Heart Sound (S1) Pulmonary (P2) and Aortic (A2) of the Second Cardiac Sound (S2) Using the Continuous Wavelet Transform (CWT). Ann Cardiol Vasc Med. 2020: 3(1); 1023.
Keywords: Spectro-temporal; Characteristics; First sound S1; Second sound S2; Component; Aortic; Pulmonary; Mitral; Tricuspid.
Abstract
The analysis of phonocardiogram signals by using the wavelet transform is a very important analysis concerning our study and it helps us to better locate the frequency ranges of heart sounds S1 and S2 as well as their internal components (mitral M1, Tricuspid T1, Aortic A2 and Pulmonary P2 respectively) and to have an overview of the spectro-temporal response.
The problem encountered when identifying the split of S1 or S2 (split: Time delay between internal components); it’s when they’re immersed in a heart murmur so there’s no way to see the sounds without the need for a digital filter.
A filter can distort the basic information: The breath or the click can contain frequencies which are superimposed on the frequencies of a heart cardiac sounds. The wavelet transform will thus allow us to locate the internal components in the cardiac sounds itself (knowing which component precedes the other is information that is very important for the diagnosis of valvulopathy.
An analysis of the frequency content of the internal components of heart sounds and their durations will necessarily provide information on the pathological severity of each case analyzed.
Introduction
Analysis of the internal components of the heart cardiac sounds S1 and S2 by the standard Fourier transform (FFT) can be used to give only information on the frequency content of the the heart cardiac sounds S1 and S2 of the studied cardiac signal as well as their internal components (A2, P2, M1 and T1). Above all, the FFT is unable to provide indications concerning the temporal evolution of the analyzed signal if the stationarity criterion is violated [1-2] (case of non-stationary signals (PCG signal)). The phonocardiogram signal representing the time course of heart sounds is considered, like many other biomedical signals, to be a non-stationary signal. To effectively understand such signals it is important to study their time-frequency characteristics. Short-term Fourier Transform (TFCT) as a time-frequency analysis method can be applied. This consists of sliding an analysis window along the signal studied, but the dimensions of this window must be fixed in order to guarantee the stationarity conditions. Unfortunately, these constraints cannot allow good resolution in time and frequency simultaneously [2]. The Wigner-Ville Distribution (WVD) which plays a crucial crucial role in time-frequency analysis responds favorably to the improvement of this analysis, however it remains limited by the problem of inter-frequency terms which generally reduce the readability of a time-frequency diagram and that it is in this sense desirable to get rid of it [2] which practically results in a remarkable lack of separation of the internal components of noise B1 and B2. Besides, the Wigner ville method is specialized in the spectro-temporal analysis of mono-component signals [3].
The wavelet transform thus remains very suitable for the analysis of the internal components of heart cardiac sounds. This technique shows its efficiency in time-frequency analysis due to its flexible and adaptive dimension analysis window which allows it to have good temporal resolution for high frequency components and frequency resolution for low frequency components [2,4,5].
The time-scale representation of the cardiac sounds S1 and S2 has been approached by various researchers [6-9], but rarely for their internal components (M1, T1, A2 and P2). Most of this work used the Continuous Wavelet Transform (CWT) to obtain a three-dimensional (time-scale-amplitude) graphical representation of the PCG signals.
The results of this work mainly concerned the comparison of the frequency content of the cardiac sounds S1 and S2 by demonstrating the more frequency content obtained which was rather delicate to find with the other time-frequency methods (STFT or WVD). The comparison of différents methods of analysis (FFT, STFT, WVD, CWT) ibution and the wavelet transform) was also taken into consideration in the study of cardiac sounds [7,8] with a preference for the transform of wavelets which made it easier to study time-frequency (or time-scale) characteristics thanks to its efficiency in separating the sub-components of heart noise [9-10].
Methods
Wavelet transforms have become well known as useful tools for various signal processing applications. The continuous wavelet transform is best suited to signal analysis.
Its semi-discrete version (wavelet series WS) and its fully discrete one (the discrete wavelet transform DWT) have been used for signal coding applications, including image compression and various tasks in computer vision.
Given a time-varying signal s(t), wavelet transforms consist of computing coefficients that are inner products of the signal and a family of “wavelets”. In a continuous wavelet transforms,
The wavelet corresponding to scale “a” and time location “b” is :
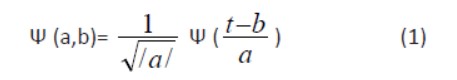
Where Ψ(t) is the “mother wavelet” which can be thought of as a band-pass function. The factor  is used to ensure energy preservation. There are various ways of discretizing time-scale parameters (b,a), each one yields a different type of wavelet transform.
The continuous wavelet transform (CWT) was originally introduced by G.Grossmann and J.Morlet. Time t and the time-scale parameters vary continuously.
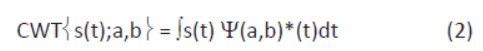
(the asterisk stands for complex conjugate).
It turned out that the "db7" wavelet, after analysis, appeared to be the one most suitable for the analysis of PCG signals. This analysis is based on the application of a large number of orthogonal and bi-orthogonal wavelets in the analysis of the PCG signal of a healthy subject (signal considered as basic signal) and each time the value of the average difference (in absolute value) between the original signal and the synthesis signal obtained by reconstruction by multi-resolution analysis (the decomposition of the original PCG signal is done on seven levels and this is the seventh detail of decomposition (d7) presenting the best information which is considered as a synthesis signal [11]), Before applying the CWT algorithm, the data (PCG signal) is filtered with a Butterworth bandpass filter if we want to separate the cardiac components and below 20Hz and above 200Hz (Figure1) [12].

Figure 1: Frequency characteristics of some cardiovascular sounds [1].
The coefficients generated are then further scaled, and plotted as a contour line, using the Matlab contour function:
Contour (Time, freq, coefs)
So we can have three different representations of the continuous wavelet transform, one with the energy percentage of each coefficient, another than with the coefficients and a last with the application of the filter. The following figure shows the strength of the method used in locating heart soundsS1, S2 and systolic murmur.
: b) Scalogram of the percentage of energy of each coefficient of the continuous wavelet, c) plotted as a contour line, using the contour function, d) contour plots, using the contour function after applying the Butterworth filter.")
Figure 2: Analysis by the continuous wavelet transform of the PCG TR signal (a): b) Scalogram of the percentage of energy of each coefficient of the continuous wavelet, c) plotted as a contour line, using the contour function, d) contour plots, using the contour function after applying the Butterworth filter.
Figure 2a shows that the systolic murmur in the PCG « TR » signal case covers the two cardiac sounds S1 ans S2, a simple analysis by application of the CWT makes it possible to localize and locate the two cardiac sounds as well as the systolic murmur (Figure 3b, Figure 3c & Figure 3d). The application of the CWT application also makes it possible to give information on the time delay and the frequency range at the same time of the different components of the PCG signal. We note that the duration of systolic murmur is greater than that of heart sounds S1 and S2, on the other hand their frequency range and very important that of the systolic murmur.
It appears that of the two components of S2 in a normal case, A2 is normally the stronger (high frequency content) with a duration shorter than P2, reflecting the high pressure in the aorta. It is heard throughout the precordial area. In contrast, P2 is relatively mild (lower frequency content) with a duration greater than that of A2, reflecting the lower pressure in the pulmonary artery. It is best heard in its own area, the juxta sternal part of the 2nd and 3rd left intercostal spaces. This is where we should look for the duplication of S2.
The first sound S1 also has two components, early mitral, the other later, tricuspid. Mitral. Its main component, is much stronger, similarly reflecting the high pressures in the left side of the heart. It can be heard over the entire precordial area and is maximal at the tip of the heart. The softer tricuspid component is heard as much as it can at the lower part of the left edge of the sternum, and this is where a doubling of S1 can be heard. The mitral component, earlier and stronger, can however mask the tricuspid and the splitting is not always detectable. A further analysis in this direction by the Continuous Wavelet Transform (CWT) is first applied to the phonocardiogram signal of a healthy subject and this analysis will therefore allow us to locate the internal components in heart sounds.
: b) Scalogram of the percentage of energy of each coefficient of the continuous wavelet, c) plots in contour line, using the contour function, d) plots in contour curve, using the contour function after application of the Butterworth filter.")
Figure 3: Analysis by the continuous wavelet transform of a PCG Normal signal (a): b) Scalogram of the percentage of energy of each coefficient of the continuous wavelet, c) plots in contour line, using the contour function, d) plots in contour curve, using the contour function after application of the Butterworth filter.
Results and discussion
Analysis of the PCG signal of a normal case by applying the CWT.
A cardiac cycle of the Phonocardiographic signal of a healthy subject is shown in Figure 3shows the result of the analysis of this cardiac cycle by the CWT. The two heart sounds (Sl and S2) are clearly visible (for the three representations). One located around 500 samples, the other around 3000 samples; they are thus distant from around 2500 samples corresponding to a time offset of 0.350 s.
: Scalogram of the percentage of energy of each coefficient of the continuous wavelet: b) A normal cardiac cycle, c) Cardiac sound S1, d) Cardiac sound S2.")
Figure 4: Analysis by the continuous wavelet transform of a PCG Normal signal (a): Scalogram of the percentage of energy of each coefficient of the continuous wavelet: b) A normal cardiac cycle, c) Cardiac sound S1, d) Cardiac sound S2.
The representation of the energy percentage of each coefficient of the continuous wavelet (Scalogram) gives a very good appreciation of the internal components of the two heart sounds. The latter clearly highlights the change in the frequency content of each internal component, so an analysis by CWT is applied for each cardiac sounds. The continuous wavelet transforms of the sounds S1 and S2 are shown in Figure 4. As illustrated in Figure 4 the sound S2 shows a higher frequency content than that of the sound S1 (Δf of 48 Hz for S1 and 80 Hz for S2). On the other hand, the duration of S2 is less than that of S1 ( Δt of 35 ms for S1 and 15 ms for S2). On figure 4c we can see that the spectral response of the sound Sl is clearly resolved in time by several components including two main ones (M1, Tl). The mitral component has a significant frequency content compared to the tricuspid component (Δf of 53 Hz for M1 and 45 Hz for T1), it should also be added that M1 has a frequency band greater than T1 (M1 [from 30Hz to 83Hz], T1 [from 28Hz to 73Hz]). The mitral component has a shorter duration compared to the tricuspid component (Δt of 13 ms for M1 and 22 ms for T1). The sound spectrum S2 on the other hand is resolved in time with fewer components compared to S1 including two main components (A2 and P2), (Figure 4d). With frequency content going from 18Hz to 98Hz (Δf = 80Hz) for A2 and from 25Hz to 89Hz (Δf = 64) for P2, the internal components of the sound S2 present the most important frequency contents compared to that of cardiac sound S1 (M1 and T1). The duration of P2 is less than that of A2 ( Δt of 10 ms for A2 and 6 ms for P2).
The time delay between the internal components A2 and P2 of the sound S2 can be easily measured from the result of Figure 4d. This measured delay is estimated at around 6 ms; it is less than 30 ms [13] as predictable for any PCG signal from a healthy subject. In pathological conditions the value of this delay can be greater than 30 ms which will give a first indication of pathology. In addition, the order of the components A2 and P2 can be reversed which will give an additional clue to specialists, these components (A2 and P2) can be easily identified by means of their frequency range (A2 being richer in frequency than P2). The continuous wavelet transform can thus provide valuable information on these components A2 and P2 and the time delay separating them, thereby allowing to have an important diagnostic parameter. Table 1 shows the time and frequency differences observed between components A2 and P2. This is confirmed, concerning the normal case by Alfredo G who has studied in this work [14] only three cases of PCG signals (N, IM and ASD).
Table 1: Time and frequency measurements on internal components (M1, T1, A2 and P2).
It is possible to deduce for the case of a Phonocardiographic signal from a healthy subject the following:
- The M1 component precedes the T1 component in time.
- The M1 component has a higher frequency content than that of the T1 component.
- Component A2 precedes component P2 in time.
- Component A2 has a higher frequency content than that of component P2.
Analysis of the PCG signal of a pathological case by the CWT
The study of a pathological case by the use of the continuous wavelet transform (CWT) allows us to focus on the power of the analysis of this technique on signals of morphology similar to a PCG signal of a subject. healthy.
a) Duplication of first cardiac sound
Figures 5, 6,7 show an appreciable difference between the case of a normal PCG (Figure 4) and that of pathological cases (MR5, MR6 and AR). The PCG signals (MR5 and MR6) which represents a mitral narrowing shows a very clear doubling of the first cardiac sounds S1, the internal mitral and tricuspid components are clearly separated. Table 2 illustrates the time and frequency differences observed between the components M1 and T1 and the time interval between them.
 Two cardiac cycles of the PCG signal MR5, b) Cardiac sound S1, d) Cardiac sound S2.")
Figure 5: Analysis by continuous wavelet transform of the PCG MR5 signal: a) Two cardiac cycles of the PCG signal MR5, b) Cardiac sound S1, d) Cardiac sound S2.
: b) Two cardiac cycles of the PCG signal MR6, c) Cardiac sound S1, d) Cardiac sound S2.")
Figure 6: Analysis by continuous wavelet transform of the PCG MR6 signal a): b) Two cardiac cycles of the PCG signal MR6, c) Cardiac sound S1, d) Cardiac sound S2.
: b) Two cardiac cycles of the PCG signal AR, c) Cardiac sound S1, d) Cardiac sound S2.")
Figure 7: Analysis by continuous wavelet transform of the PCG AR signal a): b) Two cardiac cycles of the PCG signal AR, c) Cardiac sound S1, d) Cardiac sound S2.
Table 2: Temporal and frequency measurements on the internal components (M1 and T1) of pathological cases MR5, MR6 and AR.
The frequency content is also given here by the vertical axis of the scales which we see is certainly more extensive for S2 than for Sl with a slight increase for pathological sounds Sl and S2.
For the two PCG signals MR5 and MR6, the mitral component M1 has the highest frequency content and a duration shorter than that of the tricuspid component T1. The PCG AR signal (Figure 7) shows the opposite.
In Figure 7 we can see that the sound S2 of AR is resolved in time by eight components, two of which are main. The second cardiac sound of this pathological case presents a very tight doubling unlike the S2 of the PCG signal MR5 which is slightly less tight. The S2 cardiac sound of MR6 has a unique component to it (Figure 6).
The following figure 8 which represents the PCG signal MS5 shows that the splitting can vary between two cycles, the split of the first sound S1is greater than the second split of the second noise S1.

Figure 8: Continuous wavelet transform analysis of the first two heart sounds of the PCG MS5 signal.
b) Duplication of second cardiac sound
The application of the continuous wavelet transform in the analysis of pathological cases which presents a splitting of the second cardiac sound S2 in anticipation of medical diagnosis, was tested on four different cases representing a very severe pathology compared to the normal case. The result of this application is illustrated in Figure.9 at. Figure 11.
 Two cardiac cycles of the PCG PS1 signal, b) Cardiac sound S1, d) Cardiac sound S2.")
Figure 9: Analysis by the continuous wavelet transform of the PCG PS1 signal: a) Two cardiac cycles of the PCG PS1 signal, b) Cardiac sound S1, d) Cardiac sound S2.
 Two cardiac cycles of the PCG AS5 signal, b) Cardiac sound S1, d) Cardiac sound S2.")
Figure 10: Analysis by the continuous wavelet transform of the PCG AS5 signal: a) Two cardiac cycles of the PCG AS5 signal, b) Cardiac sound S1, d) Cardiac sound S2.
 Two cardiac cycles of the PCG ASD signal, b) Cardiac sound S1, d) Cardiac sound S2.")
Figure 11: Analysis by the continuous wavelet transform of the PCG ASD signal: a) Two cardiac cycles of the PCG ASD signal, b) Cardiac sound S1, d) Cardiac sound S2.
The continuous wavelet transform (CWT) coefficients allow us to easily see the frequency range of each pathological case as well as their main components. The maximum amplitude of these components is characterized by a darker color than that of small amplitudes.
The following table gives the temporal and frequency differences observed between the components A2 and P2 and the temporal interval which separates them from the PCG signals to be tudied.
Table 3: Time and frequency measurements on the internal components (A2 and P2) of pathological cases PS1, AS5 and ASD
For all of the PCG signals, the component P2 has a duration and a frequency content greater than that of the aortic component. The study of the split of the second cardiac sounds S2 and which is none other than the temporal delay existing between the two main components of S2 namely the aortic (A2) and pulmonary (P2) components is very important. As is known, the sound S2 is composed of two acoustic components A2 and P2 due respectively to the closing of the aortic valve and to the closing of the pulmonary valve. The importance of diagnosis based on the study of S2 noise has been identified and recognized for a long time and its meaning and use for diagnosis is considered by cardiologists to be a "key" to auscultation [12]. he aortic valve usually closes, under normal conditions, before the pulmonary valve by a delay which cannot in any case exceed 30ms [13]. The value of the split S2, if it is considered to be variable along normal cardiac activity, can become relatively constant for pathological cases such as pulmonary narrowing (PS: pulmonaty stenosis) and deficiency of the atrial wall (ASD: atrial septal defect). In the case of pulmonary stenosis figure 8 the broad doubling of S2 indicates the severity of the disease. The application of the CWT on PCG signals analysis has allowed us to show that the internal components of heart sounds S1 and S2 change frequency and duration and split in the event of a pathology. This study also made it possible to realize that the CWT does not tolerate an automatic separation of the internal components since it is necessary each time to seek of which of the components which represents a cardiac sound is the main one (the most important frequency content.
Conclusion
In conclusion we can say that by applying time-frequency analysis to the different PCG signals, we can know which of the S1 or S2 sounds is directly concerned by the pathology, and even more which internal component (aortic (A1), pulmonary (P2), mitral (M1) and tricuspid (T1)) of these noises is affected (change in the frequency content and duration of the sounds S1 or S2 of the pathological signals compared to the normal case).The results obtained from the calculation of the split with the continuous wavelet transform were very satisfactory since they were able to allow the measurement of this very important parameter and very revealing of the pathology. The split of a normal case is less than 30 ms which is not the case for certain pathological signals and that the measurement using the method used to demonstrate and highlight. It was also highlighted that the value of this split can have a link with the morphology of the internal components of cardiac noise, this analysis made it possible to observe a certain fragmentation of the internal components into two or three subcomponents. It seems obvious from the results obtained that the CWT makes it possible to give a good appreciation of heart sounds and their internal components when the systolic or diastolic heart murmur prevents conventional auscultation.
References
- Samjin Choi, Zhongwei Jiang. Cardiac sound murmurs classification with autoregressive spectral analysis and multi-support vector machine technique, Computers in Biology and Medicine. 2010; 40: 8-20.
- Patrick Flandrin. Temps-fréquence, Edition Hermes, Collection traitement du signal. 1998.
- William J. Time frequency and wavelets in biomedical Signal Processing. Edited by Metin Akay. IEEE, Press Serie in BME. 1993.
- Yves Meyer. Les ondelettes: Algorithmes et applications. Edition Armand Colin. 1994.
- Bruno Toresani. Analyse continue par ondelettes. CNRS Edition. 1995.
- Meziani F, Debbal S M. “The Packet Wavelet Transform (PWT) in the analysis of Phonocardiogram’s (PCGs) Signals Aortic Stenosis (AS) and Mitral Stenosis (MS)”: Int. J. Medical Engineering and Informatics. 2018 ; 10: 2.
- Obaidat M S, Matalgah M M. Performance of the short time Fourier transfom and Wavelet Transform to Phonocardiogarm signal analysis: proceding of the ACM. Symposium an Applied computing. 1992: 856-862.
- Obaidat MS, Phonocardiogram signal analysis: Techniques and performance comparison. Journal of Medical Engineering &Technologie. 1993; 17: 221-227
- Bentley PM, Grant PM, McDonnell JT. Time-frequency and Time-scale Techniques for the classification of Native and Bioprosthetic heart valves sounds, IEEE Transactions on Biomedical Engineering. 1998; 45: 125-128.
- Cherif LH, Debbal SM, Bereksi-Reguig F. Choice of the wavelet analyzing in the phonocardiogram signal analysis using the discrete and the packet wavelet transform, Expert Systems with Applications. 2010; 37: 913-918.
- Debbal SM, Reguig FB. Choix de l’ondelette analysante et classification des signaux phonocardiogrammes en fonction des souffles surajoutés, Laboratoire de Génie-Biomédical (GBM), Département d’électronique, Faculté des Sciences de l’Ingénieur, Université A.B.Bekr Belkaid, BP 119 Tlemcen, (Algérie). 2004; 1: 1-3.
- Mgdob H M, Torry J N, Vincent R, Al-Naami B. Application of Morlet Transform Wavelet in the Detection of Paradoxical Splitting of the Second Heart Sound, University of Sussex, Brighton, UK, IEEE, Computers in Cardiology. 2003; 30: 323-326.
- Akay Y M, Welkowitz W, Kotis J. Non invasive Detection of Coronary Artery Disease. IEEE, Engineering in Medicine and Biology. 1994: 761-764.
- Alfredo G. Variation of splitting in the second heart sound. Institute of sound and vibration research 1999.
MedDocs Publishers
We always work towards offering the best to you. For any queries, please feel free to get in touch with us. Also you may post your valuable feedback after reading our journals, ebooks and after visiting our conferences.