
| Received | : | Mar 02, 2018 |
| Accepted | : | May 31, 2018 |
| Published Online | : | June 04, 2018 |
| Journal | : | Journal of Nanomedicine |
| Publisher | : | MedDocs Publishers LLC |
| Online edition | : | http://meddocsonline.org |
Cite this article: Hurth C, Contente-Cuomo T, Murtaza M, Zenhausern F. Influence of a single nucleotide polymorphism(SNP) and DNA hybridization on the drying patterns of microdroplets. J Nanomed. 2018; 2: 1010.
We have recently reported an original observation of how a specific molecular recognition between coated Polystyrene (PS) beads dispersed in solution and a solid surface can drastically change the process by which micro droplets of fluids dry. This observation simply relies on the analysis of the final dried residue on the surface, therefore involving minimal intervention by trained individuals and a minimum investment in sophisticated readout equipment. For instance, a smart phone CCD camera would suffice to provide the data required for the analysis. These recent results naturally open the possibility of developing an inexpensive point-of-care diagnostics method for diseases with a known genome recognition sequence – or a monoclonal antibody signature – using biomedical approaches at the molecular or sub-nanometric level. The present results constitute a model to study the feasibility and sensitivity of the exposed method for the characterization of a known SNP (single Nucleotide Polymorphism) in the Epidermal Growth Factor Receptor (EGFR) gene (dbSNP ID: rs1050171) identified as an early biomarker for several cancers.
For many decades, research on how the contents of a droplet can modify the drying mechanism has been going on with most studies focusing on transport processes such as the pinning of a wetting line [1,2] with some studies tackling how changes in the surface properties can affect the process as well [3-8]. Understanding how a specific molecule-receptor interaction at the solid surface affects the drying mechanism and the pattern of the final residue has promising bio-medical applications. For instance, it could be employed for the detection of biomarkers in biological fluids (e.g. effusions or blood) using an immunoassay where an antibody immobilized on the surface binds with high affinity to a specific biomarker in solution. Such a molecular recognition event is different from nonspecific vander-Waals and electrostatic interactions studied so far [5,8]. In a previous study, we showed, for the first time, how a specific biomolecular interaction between the surface and solute beads modifies the expected drying mechanism [9]. In general, nano or micro-sized beads are an efficient approach to disrupt drying mechanisms because solute particles have a strong effect on the droplet drying process [1] and the tunable properties of the particles make them amenable to biological applications [10]. Our proposed method, coupled to complex pattern-recognition algorithms [11], could then provide direct diagnosis of disease conditions for remote point-of-care applications. A first step, however, is to investigate how DNA hybridization on the surface affects the drying sequence since the specificity and thermodynamic stability of DNA base pairing creates more suitable experimental conditions for a stronger response to validate the proposed platform technology
The biotin-Streptavidin (SAv) system was initially selected for its known strong non-covalent protein-cofactor interaction, with a dissociation constant, KD= 4×10-14 M [12], or a measured stretching bond force of about 160pN per biotin-streptavidin bond [13]. The results we obtained are applicable to the study of a biomarker in solution, or immobilized onto the surface, by tagging the biomarker or its receptor with either biotin or streptavidin. To initially investigate how a model system such biotin-streptavidin influences the droplet drying process, we considered aqueous dispersions of biotin- or SAv-coated fluorescent Polystyrene (PS) particles. Encouragingly, we witnessed the first observation of how beads coated with a molecule (biotin) with high affinity for a ligand coated on the surface (streptavidin) dispersed in solution can modify the drying process of a 0.1-0.2µL droplet and the final dried residue pattern [9]. The maximum sensitivity was achieved using biotin-coated polystyrene beads (diam. 0.5µm) and streptavidin-coated glass slides. A control experiment consisted of drying similar streptavidincoated beads in the same conditions. In both cases, the particles first gather into forming a large peripheral ring. This indicates a strong contribution from radial flow and that the drying process is driven by evaporation at the wetting line. As the water evaporates, particles experience Brownian motion and the ring diameter stays constant. The two systems behave differently in the final stage: while most streptavidin-coated beads deposit in the central region of the droplet residue with fewer particles in the peripheral ring, the biotin–coated particles are much more uniform. The same observation can be drawn from comparing the radial particle distribution profile in a 90-degree quadrant area centered at the geometrical center of the droplet and with the radius of the external peripheral ring. About 30 s after the deposition, the distribution profiles show beads uniformly distributed around the center for both biotin- and streptavidin-coated solutions. However, the biotin-coated beads distribution will retain a uniform angular distribution whereas the streptavidincoated beads are concentrated within the first 50µm of radius values. These results show the different outcome due to the existence of biomolecular force that resists the wetting force of the receding wetting line.
To understand how biomolecular interactions can prevent beads, which are attached to a solid-liquid interface, from sliding along with a moving fluid, we considered the balance of the forces acting on a bead and formulated a mechanistic analytical model for one bead near the wetting line of the evaporating droplet. For a dispersion of biotin-coated beads drying on a surface coated with streptavidin, there is a biological bonding force that resists the receding of a wetting line, leaving the original drop area covered with beads that have been left behind the receding wetting line. For a dispersion of streptavidin-coated beads instead, the beads will recede with the wetting line and accumulate in larger number at the center of the original drop area. In our calculations, the biological force is three orders of magnitude larger than the drag force. This previous study also provided us with important optimal parameters such as the beads concentration and droplet volume as a compromise to observe conveniently the drying process under a low-magnification microscope within less than 2 minutes.
In the present study, we bring the investigation of biomolecular effects on droplet drying to the next level by extending our results to DNA sensing, which is of prime interest for translating the method to precision health and remote diagnostics for global health applications.
The proposed sensing method is based on selective oligonucleotide hybridization. The polystyrene beads and glass surface are selectively chemically modified with an oligonucleotide sequence complementary to different regions of the target DNA sequence. The target DNA sequence should be kept short (20-60 base pairs) to avoid self-dimerization within longer fragments that will prevent proper hybridization with the probes on the beads and on the surface.
To test our assay approach (Figure 1), we chose the model system of a SNP in the EGFR gene (dbSNP ID: rs1050171) using several synthetic oligonucleotide sequences coupled to the sensing moieties at two different levels:
(1) Streptavidin-coated glass surfaces are modified with a short 24-bases nucleotide complementary to the 3' end of rs1050171. This oligonucleotide is labeled with biotin at the 3' end to facilitate its attachment to the surface.
(2) Streptavidin-coated PS beads (diameter: 0.4-0.6 µm, SVFP-0552-5, Spherotech, Inc.) are conversely modified using 36-bases oligonucleotides of two types complementary to the 5' end of rs1050171. One oligonucleotide is complementary to one allele (T at position 26) whereas the other one contains a mismatched base (G at position 26). Once again, these oligonucleotides are labeled with a biotin at the 5' end for coupling to the streptavidin-coated beads. Table 1 summarizes the oligonucleotide sequences and their relation with rs1050171. All PS beads dilutions were performed using buffers recommended by the beads manufacturer to maintain the DLVO forces to prevent aggregation. In addition, beads were re-suspended by vortex before each use to further prevent all aggregation false positives – as characterized by an optical observation.
When the target EGFR sequence is present below the detection limit (or absent), the sensor beads are expected to "slide" on the sensor substrate. Above the detection limit, the target EGFR DNA amplicon serves as a bridge between the sensor substrate and the sensor bead creating a stable specific hybridization interaction between the beads and the surface leading the beads to "stick" and perturb the receding wetting line.
 and the negative control test (right).")
Figure 1: Proposed detection strategy focused towards rs1050171 EGFR describing a positive reaction test (left) and the negative control test (right).
Table 1: : Context sequence and synthetic oligonucleotides designed for the sensing of rs1050171 EGFR SNP. (*) calculated at 250 pM in 180 mM Na+ equivalent and at 25 °C.
Theoretical values of melting temperature, Tm, and the free energy of hybridization with the context sequence, ΔGint, were computed using Net Primer (PREMIER Biosoft, Palo Alto, CA). Table 1 summarizes the oligonucleotide sequences used in relation to the target context sequence as well as Tm and ΔGint values. The oligonucleotides chosen to coat the beads and the surfaces were checked against hairpin formation and excessive GC content. The possible interaction between oligonucleotides (cross-dimers) was estimated using Net Primer. No cross-dimers with a free energy of hybridization ΔGint lower than-8kcal/mole were found; this guarantees only specific hybridization events in our experimental design.
n order to reduce the Tm values, the beads and surfaces modified with the biotinylated oligonucleotides are used in a final buffer (e.g. 10 mM Tris, 1 mM EDTA, pH=8.0) at high salt concentration (1-5M NaCl). High monovalent salts contribute to reducing the hybridization temperature and reduce the annealing times [14].
The glass beads were coated with 5'-biotinylated oligonucleotide using the following procedure [6]. 0.5mL of the stock beads (Spherotech SVFP-0552-5) at 0.1% w/v in 0.1M PBS, pH=7.4 were vortexed and centrifuged for 2min at 14,000rpm (16,000g), then re-suspended in 0.2mL 0.1M Tris, pH=7.4 (Sigma Cat. T1944) and centrifuged for 4min at 14,000rpm. After resuspension in 10mM Tris, 1mM EDTA, pH=8 (Fluka Cat. 93283), 20µL oligo stock was added at a final concentration of 10µM. The solution was incubated for 1h at RT (≈22 °C) on a spinning wheel, and then centrifuged for 4min at 14,800rpm. The beads were washed with 0.2mL deionized water, centrifuged for 1min at 14,800rpm, and re-suspended in 0.2mL 10mM Tris, 1mM EDTA, 0.5 M NaCl, pH=8 (Teknova Cat. T0231) for further use.
Similarly, the Streptavidin-coated (SAv) glass slides were derivatized with 3'-biotinylated oligonucleotides. 30µL droplets of stock (100µM) 3'-biotin oligonucleotide solution were deposited on the surface using a micropipette for 30-60s. The spots modified with the oligonucleotides were then rinsed with the same volume of deionized water by pipetting the volume back and forth on the surface with the pipette 3-5 times to ensure proper wetting of the surface and removal of non-specifically bound oligonucleotide.
The details of droplets to be deposited on the 3' biotinylated oligonucleotide glass slide surface are given in Table 2. To evaluate the specificity of the method, Type 1 bead-coupled 5'biotinylated oligonucleotides (T variant) as well as Type 2 bead-coupled 5'biotinylated oligonucleotides (G mismatch) were deposited on the streptavidin surface. For Type 2 beads, the interaction between the modified beads and surface is expected to be weaker and the beads should mostly slide off the surface even in the presence of high EGFR A/A amplicon concentrations.
The beads were deposited on the surface using the following method. A 50µL volume of oligonucleotide-bound beads was first heated to 72 °C on a PCR cycler (Eppendorf Mastercycler® nexus) while shaking the sample tray at 650rpm. The EGFR PCR amplicons ([A/A] and [G/G] alleles) were denatured at 95°C for 90s and placed on ice. The solutions listed in Table 3 were then incubated at 72°C while mixing at 650 rpm for 30min and diluted 1:2000 with Teknova T0231 buffer. 0.1µL droplets were then deposited on the SAv surface with 3'-biotin-oligonucleotide using a Gilson P2 pipet on a heated glass slide and left to dry (T≈22°C, RH=30%) before imaging using fluorescence microscopy
Table 2: : Droplet solutions arrayed in replicates on the surface modified with 3' biotinylated oligonucleotides for a given bead dilution, EGFR amplicon concentration. (*) Binding buffer: 10mM Tris, 1mM EDTA, 2M NaCl, pH=8.0.
Table 3: : Droplet solutions arrayed in replicates on the surface modified with 3' biotinylated oligonucleotides for a given bead dilution, EGFR amplicon concentration. (*) Binding buffer: 10mM Tris, 1mM EDTA, 2M NaCl, pH=8.0.
To assess assay performance using DNA mixtures with known alleles, three control DNA samples from the Human Random Control DNA Panel 3 were used (Sigma-Aldrich). The genotype of control samples A02, A04 and A06 was evaluated using a quantitative PCR assay targeting SNP rs1050171 (TaqMan® Predesigned SNP Genotyping Assay Product Number C_2678675_20, Life Technologies, Foster City, CA). This assay uses two allelespecific probes containing distinct fluorescent dyes and a pair of PCR primers to amplify the target region and distinguish the two SNP alleles. Assays were performed on a Light Cycler 480 Instrument II and allelic discrimination plots to identify control samples with homozygous A/A and G/G or heterozygous genotypes (A/G, 50% of each allele). Once control sample genotypes were known, the same assay was used to generate PCR amplicons using duplicates of the three control samples. 50-μL PCR reactions were performed using 45μL Platinum PCR Super mix (Thermo fisher), 1.25μL of the assay, 1μL of template DNA and 2.75μL of molecular grade water. PCR was performed using the following conditions: 1 cycle at 94°C for 2min, 35 cycles of 94°C for 30s, 60°C for 30s and 72°C for 45s, 1 cycle at 72°C for 1 min followed by a hold at 4°C forever. PCR product was purified using magnetic bead purification (SPRI select) using 1:1 volume ratio of bead buffer and PCR volume and eluted into 50μL. The final DNA concentration was determined using the 260/280 nm method with a UV/Visible spectrophotometer and was typically around 2ng/µL (0.1µM).
A bare clean glass slide was placed on a copper wire mesh. The copper wire was then heated using a constant-current DC power supply until the temperature on the surface of a streptavidin-coated test slide placed on top of the bare glass slide, as measured by a Type K chromel-alumel thermocouple, was equal to the calculated Tm value form Table 1. Figure 2A shows the glass heating apparatus consisting of the copper wire and a cover to maintain the temperature and humidity in close proximity of the surface. A linear relationship for the temperature with the supplied DC current was obtained to calibrate the heating system (data not shown) between 72 and 82°C where a change of 3°C occurred for a 0.1 A increase in the supplied current. Figure 2B shows the infrared thermal mapping of the glass surface using a portable FLIR E50 camera (FLIR Systems, Wilsonville, OR). A stable uniform temperature is obtained 70 s after flowing current through the copper wire
The fluorescent polystyrene streptavidin-coated beads used either had a "yellow" (Spherotech, Inc. SVFP-0552-5) or "Nile Red" (SVFP-0556-5, Spherotech, Inc.) dye embedded in their core. They emit with a maximum at 500 and 560nm, respectively, when excited at 488 nm. To visualize them, an inverted Nikon Ti-U microscope with a 10X objective and FITC and Cy3 filters sets was used.
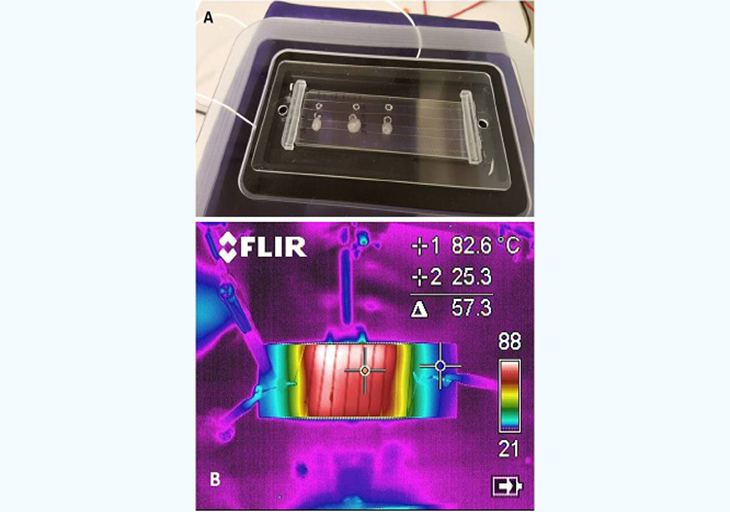
Figure 2: (A) Slide heating setup showing the heated copper wire and the plastic cover to maintain the temperature and humidity near the surface. (B) Infrared temperature mapping showing the temperature uniformity over the entire sldie obtained 70s after flowing current through the copper wire.
First, the optimal coupling conditions between the biotinylated oligonucleotides, the beads and the surface have been determined. The preferred bead concentration that shows a significant effect while allowing easy observation using fluorescence microscopy was determined and resulted in additional 1:2000 dilution before deposition. The surfaces and solutions were held at the calculated Tm values for each oligonucleotide within 1ºC or less [15]. The chosen oligonucleotide concentration to derivatize the beads was determined given the measured streptavidin surface coverage provided by the manufacturer. A relatively high final concentration of PCR amplicon was chosen to ensure the system works above its detection limit to illustrate, for the time being, the proof of concept of our proposed method. According to the model developed for the biotinstreptavidin model [9], the detection limit correlates with the minimum biological bonding force, or DNA hybridization force, that is generated to balance the drag force of the receding wetting line.
The total number of particles on the surface of each experiments was determined using image thresholding and particle analysis in Image J (National Institutes of Health, Bethesda, MD) limited to particles for sizes between 0 and 100pixels2 with a circularity from 0.0 to 1.0 (spherical). In each case, the number of particles on the surface is similar, which excludes any effect of the number of particles considered in the observed img. Typically, between 160 and 190 particles were deposited on the surface in the observed field of view of the drying 0.1-0.2µL droplet.
A first set of experiments was carried out involving direct interaction between one DNA fragment linked to the surface and another one on the bead in the presence or absence of the complementary DNA target, as well as in the presence of a complementary DNA target sequence with one mismatched base (SNP). For this, the streptavidin-coated surface was modified with a 3´-biotinylated oligonucleotide whereas the beads were modified with a 5´-biotinylated oligonucleotide (Table 1). Then, the target DNA was added as an allele-specific PCR amplicon after incubation while the glass surface was maintained at a temperature optimal for hybridization during the entire time needed for the droplet to dry on the surface (typically 100- 130seconds). The corresponding results are shown in Figure 3. In the first case (A-B), no EGFR target DNA is present and the "control" beads deposit mostly as a central bump with only a very small amount of beads outside this central area as judged by the fluorescent image. This situation is the expected normal evolution of a droplet containing particles with an average diameter of 0.5 µm given the temperature applied to the surface, as Marangoni recirculation from surface tension gradients will dominate radial flow [16,17]. When the A/A allele PCR-amplified DNA target is added to a final concentration around 30pg/ µL, the final distribution of the beads in the dried residue is very different from the "Control" (C-D). The fluorescence image indeed shows that the beads deposit more uniformly when the A allele target is present as the interaction between the surface and the beads mediated by the target DNA is able to overcome the Marangoni recirculation and radial forces during the drying process. This situation is in agreement with the expectations from preliminary results using biotin-streptavidin [9] where the biological force between coated beads and the surface disturbs the expected drying mechanism of sub-microliter droplets. The situation using the G/G amplicon instead offers an intermediate state between the control and the A/A allele in terms of bead distribution in the droplet measured by fluorescence microscopy during the drying process (E-F). Most oligonucleotide-coated beads are still in the central region and the peripheral ring, but a closer examination shows the beads are more scattered around on the surface defined by the initial droplet imprint upon deposition on the surface. Such a situation is understandable as we expect less interaction between the beads and the surface given the SNP mismatch. The results from Figure 3 support our hypothesis that when the EGFR SNP target is absent, the PS beads modified with a sequence complementary to the 5' end of the target simply slide onto the surface modified with a sequence complementary. However, when the EGFR target sequence is present, the beads and surface are linked by hybridization of the strands immobilized respectively on the bead and the surface to the respective sequence region on the EGFR amplicon.
A mixed situation is obtained when the mismatched allele is dried on the surface showing the potential of our proposed method to detect SNP polymorphisms. To further quantify the differences in the fluorescence signature of the residue of the different type of beads upon drying on the surface, we used radial distribution analysis and particle analysis with Image J (National Institutes of Health, Bethesda, MD). Figure 3G compares the average radial distribution frequency over 180° from the center of the image, i.e. the center of the initial deposition area. In the case of the control (no EGFR), over 90% of the fluorescence intensity (or beads) is contained within the first 100µm value of radiuses (maximum: 188µm), which reflects the presence of the beads in a central bump feature on the droplet residue. When the A/A allele, is present, the normalized radial distribution of the fluorescence intensity varies by only a few % around a central value of 20% all along the radius of the fluorescence image. This denotes a very uniform distribution of the fluorescence intensity, i.e. the beads, on the surface. When the G/G allele is present, the radial distribution profile shows an intermediate situation where about 80% of the intensity is obtained within the first 140µm (out of 188 µm along a radius. This is less compact than for the control, but not as uniform as for the A/A allele experiment, which also suggests a weaker interaction – rather than no interaction – between the beads and the surface.
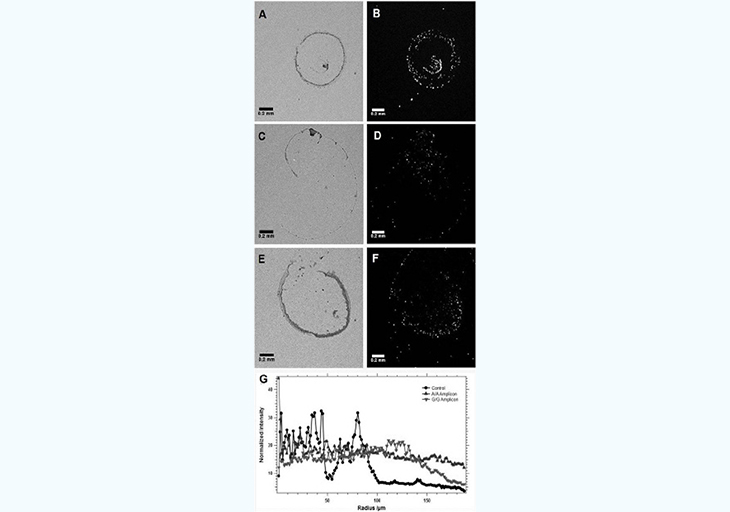
Figure 3: : Differences in drying pattern of a droplet ontaining PS beads modified with a complementary sequence to the 5' end of the EGFR amplicon on a surface modified with a complementary sequence to the 3' end when either no EGFR amplicon (A,B), the A/A allele (C-D, or the G/G allele (E,F) is present. To translate the images into a quantifiable observable, the integrated intensity for the radial distribution of pixels in each fluorescence image (B,D,and F) is presented depending on the presence of the EGFR allele type (G). Bright field images (A,C, and E) are shown indicatively, but are not used for the analysis.
In the previous experimental approach, it is difficult to maintain the slide and the beads at temperatures above the Tm of the oligonucleotides used to ensure efficient selective hybridization. To simplify the experimental protocol, a secondary characterization experiment was set up. A simple bare glass slide (Fisher brand, cleaned with methanol) is used along with two types of beads: one coated with 3'-biotin-oligonucleotide with Nile Red fluorescent dye embedded in the hollow core, and another coated with the 5'biotin-oligonucleotide and Yellow dye embedded in the hollow core. Dual filter imaging (FITC and Cy3 filter sets) and image overlay was used to reveal the differences in the proximity of the two types of beads when EGFR is present or absent. Both the center and the edge of the droplet dried residue was systematically imaged (Figure 4). The absence of temperature gradients, since the slide is no longer heated, remove the dominance of Marangoni flow during the drying process and radial flow dominates [16], which is the reason why most droplet residue show a coffee-ring pattern where most beads are accumulated in the peripheral ring. However, in the control experiment (Figure 4, no EGFR amplicon present), the amount of beads present in the peripheral ring vs. those in the rest of the droplet residue is much higher than for the EGFR A/A allele (Figure 5). This is most likely because when beads of the two types are bridged into larger aggregates by the EGFR amplicon, the wetting line, given the drag force during the drying process, can no longer carry their increased weight and they tend to deposit onto the surface. In the presence of the EGFR A/A amplicon (Figure 5), there are clearly a much higher number of pixels in the Boolean AND combination of the FITC and Cy3 fluorescence img from each of the two types of beads used, especially in the central area of the droplet. Typically, less than 2% of pixels are positive in the Boolean image when no EGFR is present (Figure 4C,F) compared to over 20% when EGFR is present, with much larger areas (Figure 5C,F). This indicates a much higher occurrence of the close proximity of a beads emitting red fluorescence (observed with the Cy3 filter) and beads emitting green fluorescence (observed with the FITC filter) when the EGFR amplicon is present. Similarly, it suggests that the red beads and the green beads, each modified with a complement sequence to opposite regions of the EGFR amplicon, are located much closer to each other and occasionally aggregated in the sample containing the EGFR A/A amplicon than in the control where no sample is present. The results from Figures 4 and 5 corroborate those of Figure 3, but with a simplified experimental setup that does not require a modified glass slide maintained at a precisely controlled temperature. In each type of experiment, we show clear evidence that the presence of the target EGFR DNA strongly modifies the behavior of the microdroplet upon unforced drying in ambient atmosphere.
With added quantification using pattern recognition algorithms for automated image analysis, our observations can lead to a rapid diagnosis method for the presence of a short (< 60 base pairs) SNP DNA target relevant to a particular disease, similarly to the presented model with a registered EGFR SNP. Efforts are now focused on determining the limit of detection. In the reported results, the final DNA concentration from dilution of the PCR amplicons is around 40pg/µL, which would correspond to a limited number of PCR amplification cycles [18]. Therefore, in its current state, the proposed method would require target amplification prior to detection.
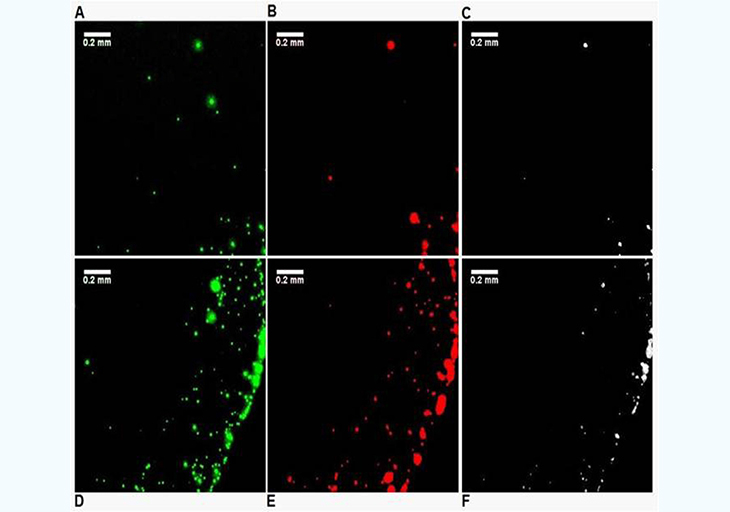
Figure 4: : Differences in drying pattern at the center (A,B,C) and edge (D,E,F) of a droplet containing i) red-fluorescent (Cy3) PS beads complementary to the 5' end of the EGFR amplicon, and ii) green-fluorescent (FITC) beads complementary to the 3' end on a glass surface when no EGFR amplicon is present. The images on the right (C,F) are Boolean AND combinations of the (A,D) and (B,E).
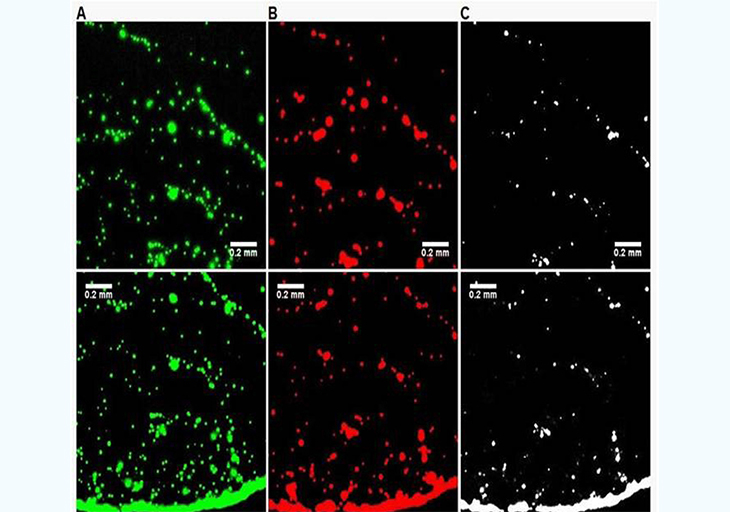
Figure 5: : :Differences in drying pattern at the center (A,B,C) and edge (D,E,F) of a droplet containing red-fluorescent (Cy3) PS beads complementary to the 5' end of the EGFR amplicon and green-fluorescent (FITC) beads complementary to the 3' end on a glass surface when the A/A allele is present at 58pg/µL. The images on the right (C,F) are Boolean AND combinations of (A,D) and (B,E) and show locations where beads of each type are in close proximity. The presence of the EGFR amplicon increases the number of events in the Boolean image indicating the presence of aggregates formed with each bead types, most likely bridged by the EGFR target.
In line with our recently published original observations of how biotin beads modify the drying mechanism of micro droplets on streptavidin-coated slides, we present results, using two alternative experimental characterization methods, on how specific DNA hybridization can be detected using similar changes to the final dried residue of micro droplets containing similar beads modified with specific DNA sequences. We chose a model system of a well-known SNP of the EGFR protein involved in several devastating cancers, but our results merely illustrate how the proposed method can be applied to rapid imagingbased diagnosis of a multitude of biomarkers. We analyze fluorescence microscopy data to show how the final distribution of fluorescent beads – modified with a complementary sequence to the 5´end of the EGFR DNA target – is affected by the presence of the target. We used either a glass surface, or a second set of fluorescent beads modified with a sequence complementary to the 3´end of the EGFR DNA target. A first experimental method using a chemically modified glass slide maintained at a control temperature close to the melting temperatures, Tm, of the DNA fragments used provides a simple image analysis, but requires a more complex experimental setup while the second method requires dual fluorescence channel imaging but uses a simple glass slide at room temperature. In each case, we provide clear evidence of the detection of the EGFR target DNA at a final concentration around 40pg/µL. Our results are very promising towards developing biomedical diagnostic methods for handheld portable Point-Of-Care (POC) devices. All the more so as our experimental strategy can be adapted to immune assays instead of DNA hybridization for protein detection as well by immobilizing antibodies rather than DNA oligonucleotides. Multiplexing assays would also be of future interest for low cost arrays.
The authors acknowledge funds from the University Of Arizona College Of Medicine (Phoenix) and the Translational Genomics Research Institute. Funding support for MM and TC was provided by Science Foundation Arizona. In addition, the authors are thankful to Dr. Daniel Attinger at Iowa State University for initial helpful discussions.
We always work towards offering the best to you. For any queries, please feel free to get in touch with us. Also you may post your valuable feedback after reading our journals, ebooks and after visiting our conferences.

